
Climate Week in New York ended on 27 September with a blunt message. Its organisers said the challenge is no longer ambition but implementation. They blamed outdated regulation, infrastructure constraints and misaligned markets, as per recent reporting. The backdrop is weak. COP30 in Belém set no timetable for phasing out fossil fuels.
That framing matters. For a decade, the transition debate was about cost. Solar and wind have largely won it. The new contest is about time.
Why the clock now beats the cost curve
Electricity demand is rising faster than new plants can be built. The global energy agency, IEA, expects data-centre use alone to more than double to about 945 TWh by 2030, slightly more than Japan consumes today, according to its latest assessment. Indoen Energy has already tracked how data centres are reshaping India’s solar demand.
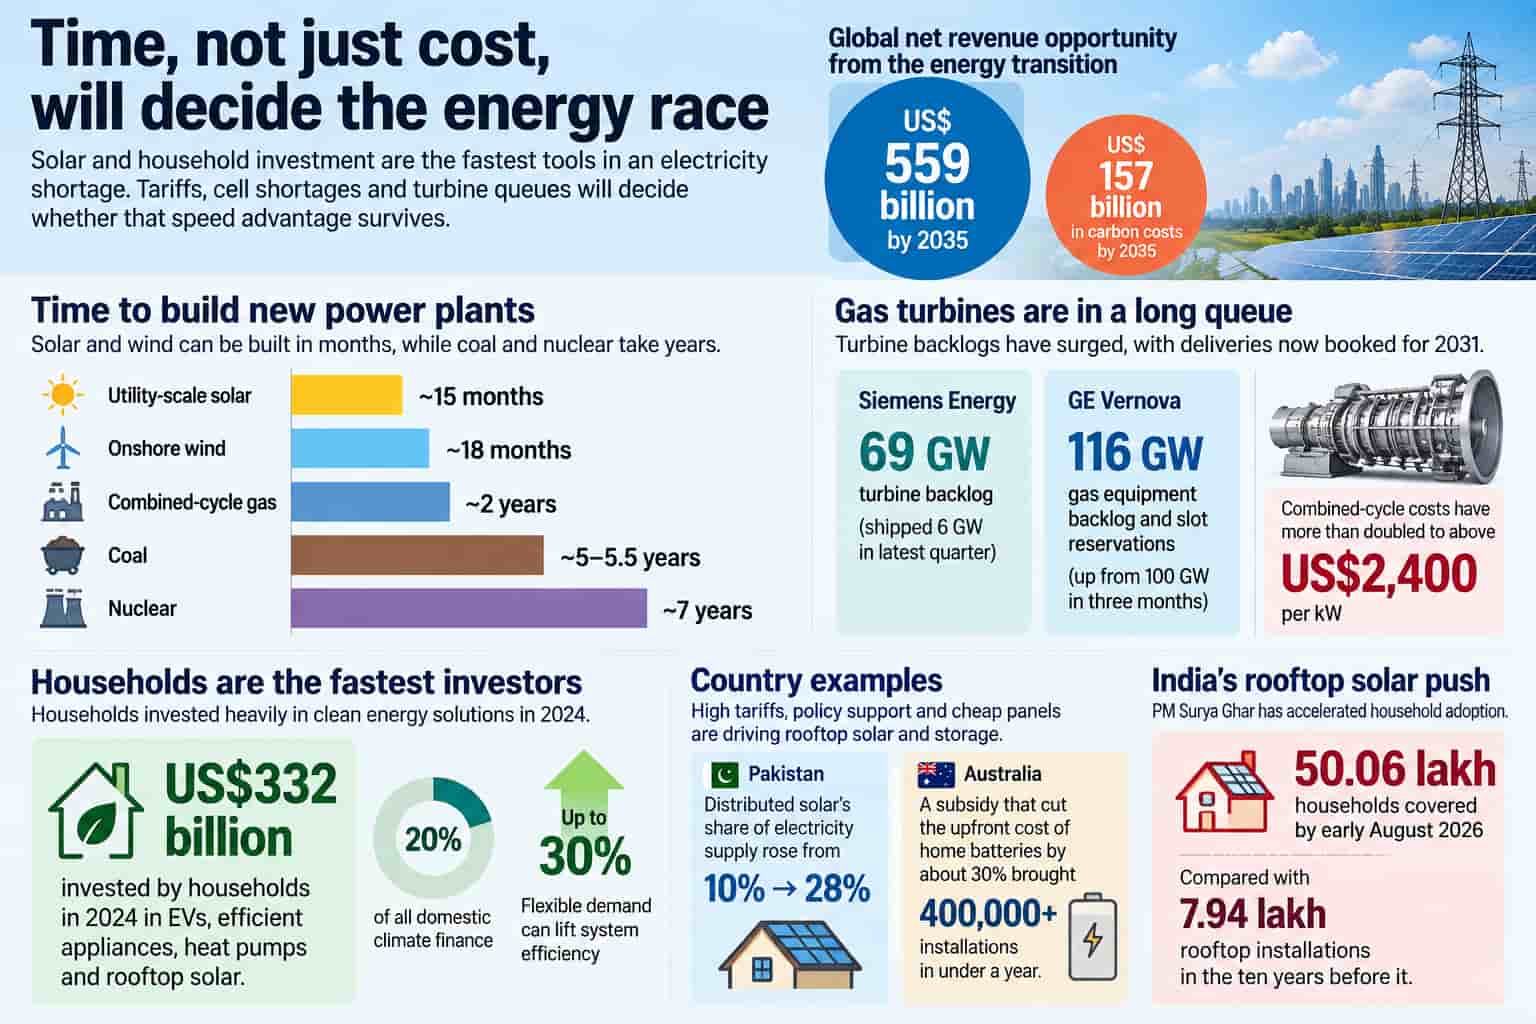
A cheap plant in 2035 cannot serve a data centre that wants power in 2028. On standard assumptions, utility-scale solar takes about 15 months to build and onshore wind about 18. A combined-cycle gas plant takes around two years, coal five to five-and-a-half, and nuclear seven, industry analysis suggests.
Gas, the old quick fix for firm power, is now stuck in a queue. Siemens Energy shipped 6 GW of turbines in its latest quarter but ended with a 69-GW backlog. GE Vernova’s gas equipment backlog and slot reservations rose to 116 GW from 100 GW in three months, and it is already booking for 2031. Combined-cycle costs have reportedly more than doubled to above US$2,400 per kW.
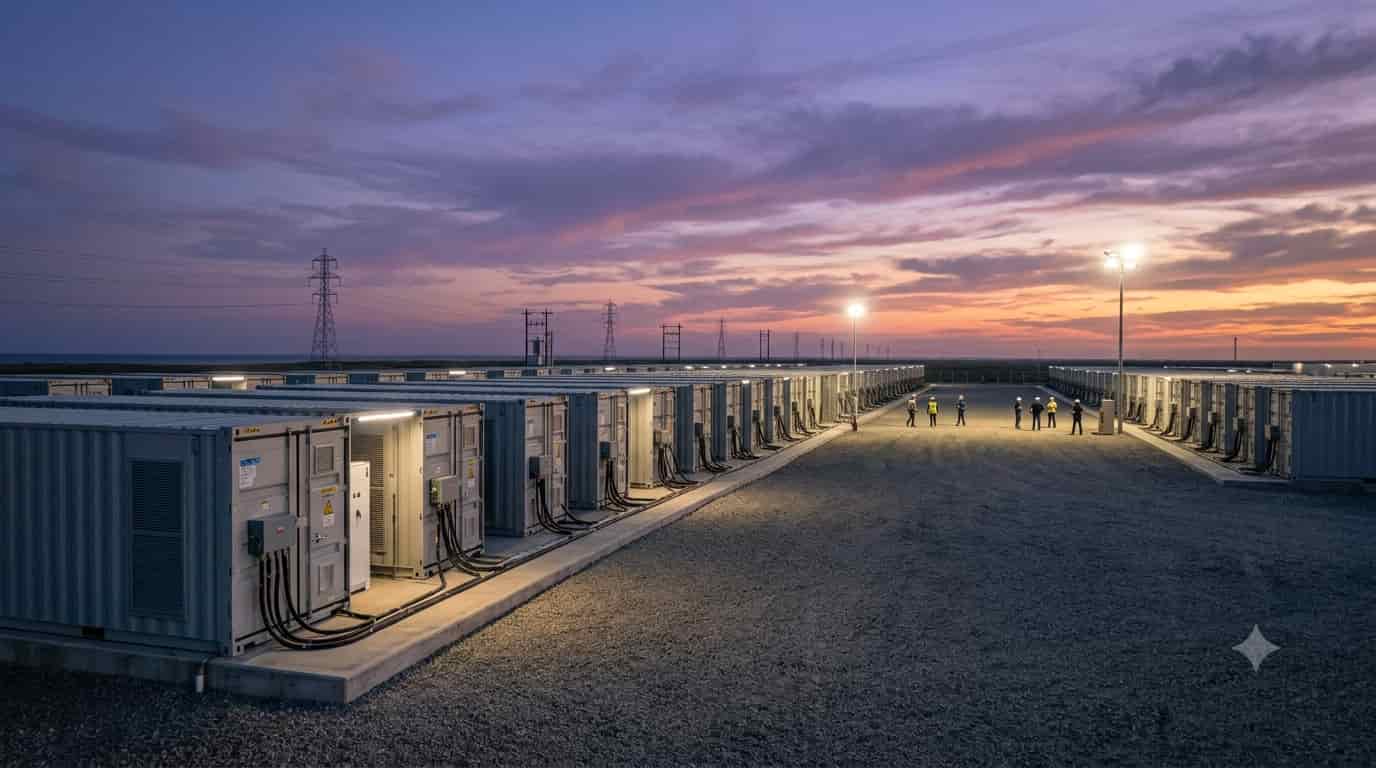
Set that against a solar-plus-storage project, which can be ready in 18 to 20 months in favourable markets. A turbine slot booked today for 2031 takes more than twice as long. The turbine may well arrive after the customer does.
There is a caveat. Solar is not firm power, and a finished farm is useless without a grid connection. More than 2,500 GW of renewable, storage and large-load projects are stuck in grid queues worldwide, and new transmission can take five to 15 years. India knows this problem, as Indoen Energy's analysis of its own grid queue showed. Speed helps only when the wires are ready.
Households are the fastest investors
The quickest capital in the system sits in homes. Households invested US$332 billion in electric vehicles, efficient appliances, heat pumps and rooftop solar in 2024, about 20% of all domestic climate finance, a recent commentary notes.
Price shocks push them faster. The Iran war lifted energy prices to almost three times pre-crisis levels in some countries. Flexible demand adds to this, and the same commentary says it can lift system efficiency by up to 30%.
Pakistan is the sharpest example. Distributed solar’s share of its electricity supply reportedly rose from 10% to 28%, driven by high tariffs, patchy grids and cheap Chinese panels. Australia shows the policy route. A subsidy that cut the upfront cost of home batteries by about 30% brought more than 400,000 installations in under a year.
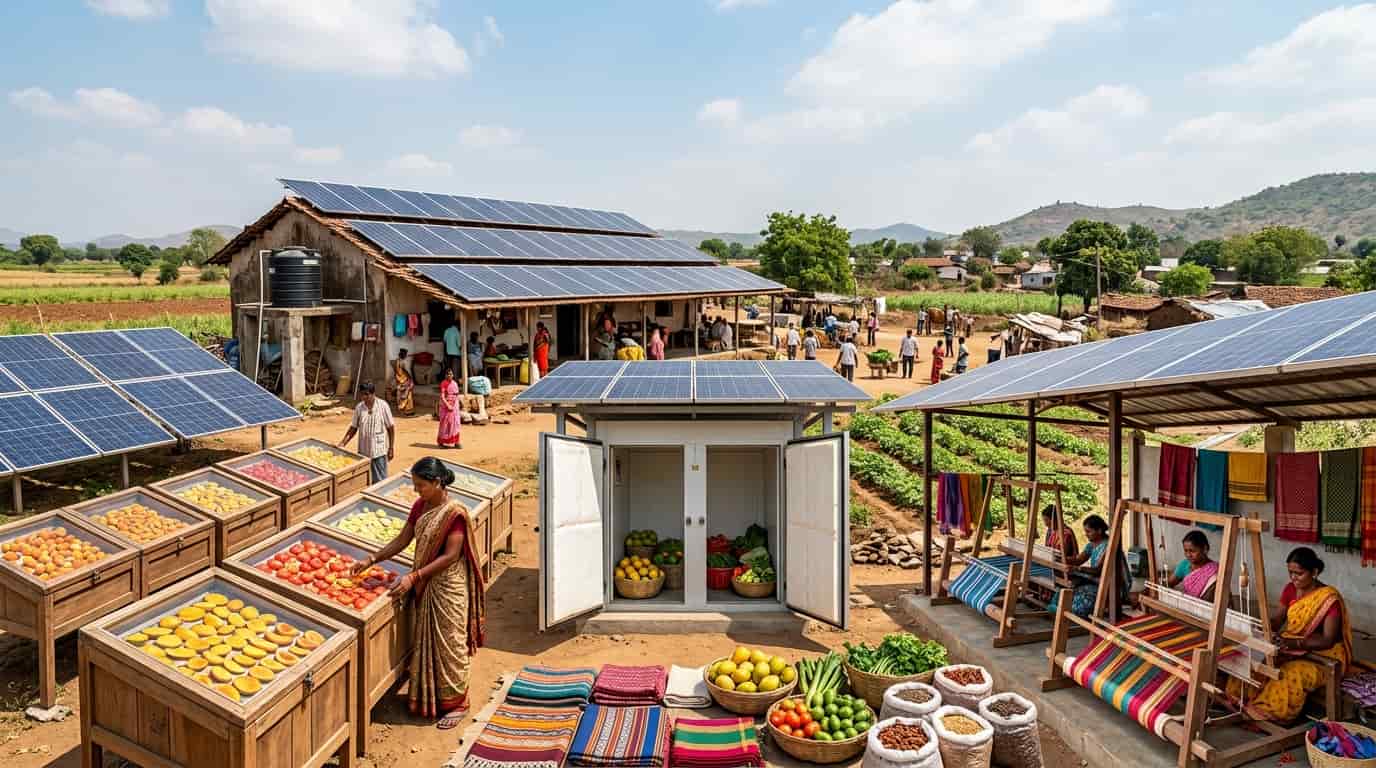
India’s version is PM Surya Ghar. By early August 2026, the scheme had covered 50.06 lakh households, against 7.94 lakh rooftop installations in the ten years before it, government data shows. July alone added 5.06 lakh homes. On the government’s own comparison, that is roughly six times the previous decade’s pace. The outlay is ₹75,021 crore (US$7.8 billion), as per recent reporting.
Yet the target of 1 crore homes by March 2027 looks tight. Officials expect close to 90 lakh installations, as per recent reporting. Indoen Energy has also examined the uneven economics of India’s rooftop solar.
 Where speed meets the customs wall
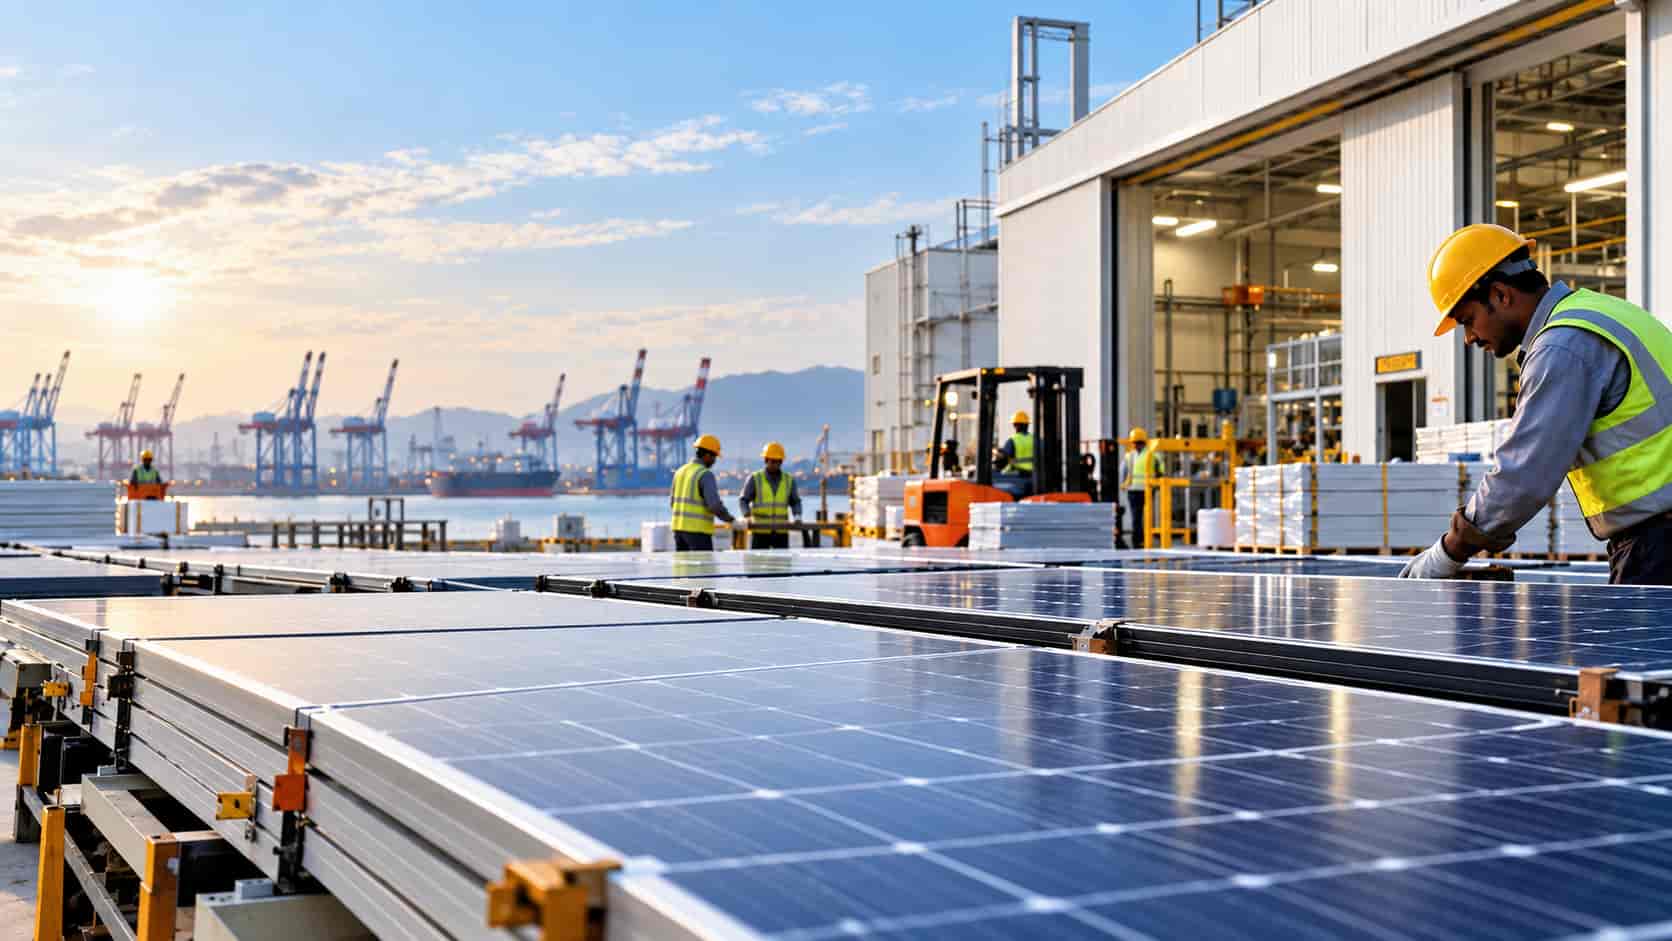
Modular hardware is fast only if it can cross borders. A recent analysis found tariffs rising on solar cells, electric vehicles and batteries in many countries. Governments call them protection for jobs and sovereignty. Central bank analysts in Europe warn they make green products costlier than conventional ones.
India is part of this pattern. It cut its basic customs duty on imported cells and modules to 20% in 2025, with a cess on top. From 1 June 2026, ALMM-II requires government-backed projects to use domestic cells. Net-metering and open-access projects follow once waivers end on 31 December 2026. PM Surya Ghar also requires Indian modules and cells, official material states.
The gap is stark. Domestic cell capacity is near 31 GW, against about 193 GW for modules, as per recent reporting. A New Delhi-based think tank found domestic cells 45% costlier than imported ones even after duties, at US$0.077 per watt against US$0.053, on October 2025 prices.
The effect shows in the numbers. India added a record 34 GW of solar in the first half of 2026, up 38%, as developers raced to beat the deadline, a consultancy review found. It expects a slowdown next. Cell output of about 29 GW next year would fall 21 GW short of annual module demand. System prices are therefore forecast to fall just 3% between the last quarters of 2026 and 2027, the same review adds. A policy deadline, not a price signal, set the tempo of India’s biggest solar half-year.
An executive at one of India’s leading renewable energy developers put the worry plainly. ‘We support domestic cells. But a mandate works only if the factory is ready before the deadline. Otherwise developers pay for the gap.’
The case for the wall is real. China holds over 85% of global cell capacity, rating agency analysis shows. About 14 GW of new Indian cell capacity is under construction, and industry reports suggest the cell crunch may ease within a year. Pakistan’s boom, meanwhile, also reflects failure. It grew out of unreliable grids, not careful planning.
BRICS and the carbon ledger
The same tension ran through the BRICS summit in New Delhi on 12 September. Members unanimously adopted a declaration backing a photovoltaic industry action plan, value addition in critical minerals and principles for smart grids and storage.
It also said fossil fuels will still matter for emerging economies, and it rejected carbon border measures as discriminatory, media reports say, with a second report noting there is still no date for fossil fuels to lose ground.
A policy adviser familiar with the negotiations read it as an industrial signal. “The declaration is less about picking a fuel than about who controls the supply chain, and how fast a country can build one.”
The money at stake is large. A new outlook models net carbon costs for corporates rising from US$74 billion in 2025 to US$157 billion in 2035. Against that, it sees a net revenue opportunity of US$559 billion for the same sectors, BloombergNEF’s research suggests. That is about 3.6 times the carbon bill.
The gains are uneven. Steel and other materials would carry over a quarter of carbon costs by 2035, up from 10.7% today. Indoen Energy has already covered India’s steel exposure.
Oil and gas face a double hit, with 15.6 million barrels a day of oil demand displaced by 2035, against 3.2 million in 2025. Clean-power-heavy firms such as Adani Green are among the modelled winners.
The modelling also carries a warning. Europe’s grids are expected to saturate, with new capacity peaking in 2031. The opportunities depend on companies building capacity. The losses in shrinking markets come with more certainty.
What to watch next
Three markers will show whether India keeps its speed. The first is 31 December 2026, when ALMM-II waivers lapse. The second is domestic cell output against module demand. The third is the monthly run-rate of PM Surya Ghar. A wafer mandate follows in June 2028.
The wider lesson is simple. Cost tells a developer what to build. Time tells a country what it can actually use. Tenders that publish delivery dates beside tariffs would make that trade-off visible. As BRICS chair, India can protect factories or protect pace. Its task is to do both, and the next twelve months will show how.