
Before the war, India leaned heavily on the Gulf for its gas. It imported more than 25 million tonnes of LNG in 2025, and over 40% of that came from Qatar. When the conflict began, one Indian importer said India was ‘badly positioned.’
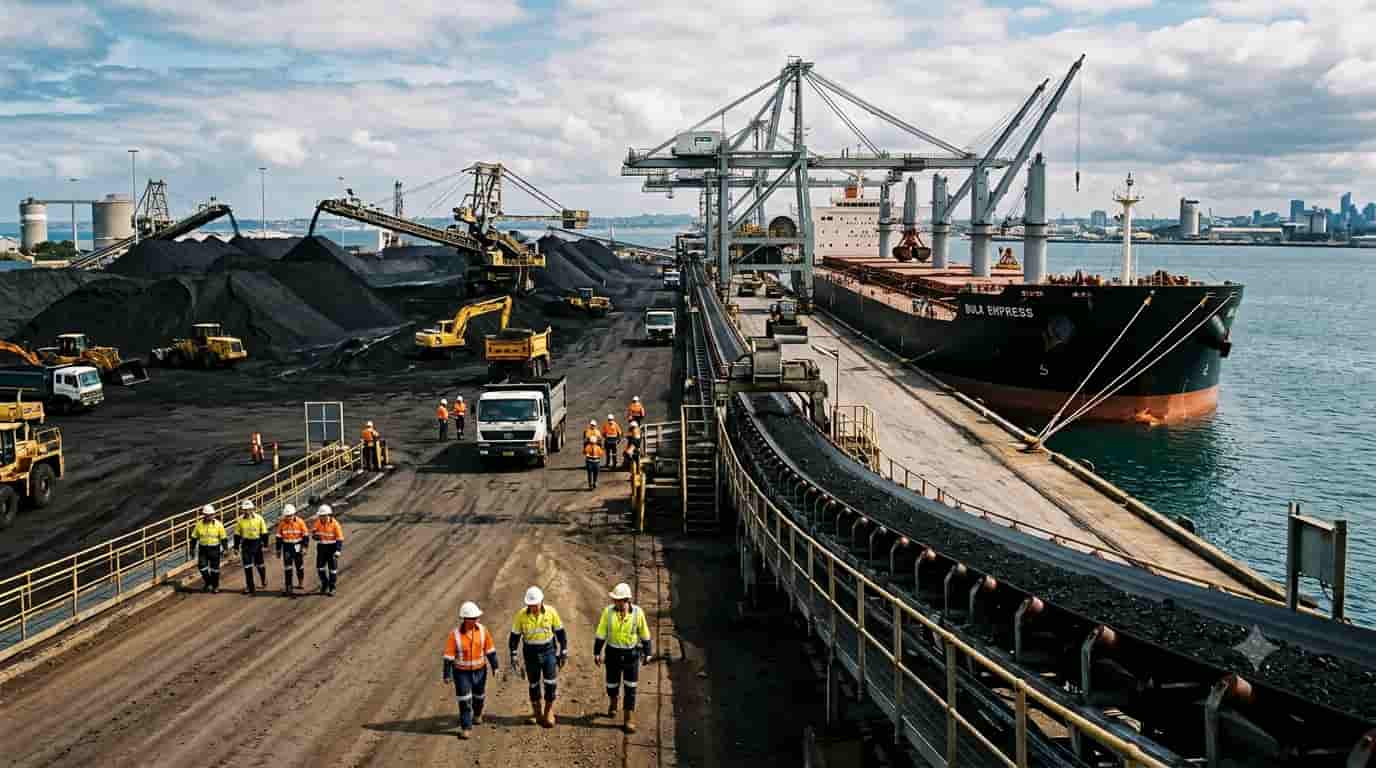
More than seven months later, port-call data shows how quickly the picture changed. Indoen reviewed a ship agent’s list of LNG arrivals at Indian terminals from January to September. After removing cool-down calls, 287 cargoes remain. They add up to about 38.8 million cubic metres, or roughly 17.5 million tonnes at 0.45 tonnes per cubic metre. The list may not capture every cargo, so shares are best read as indicative.
Qatar’s cargoes stop almost overnight
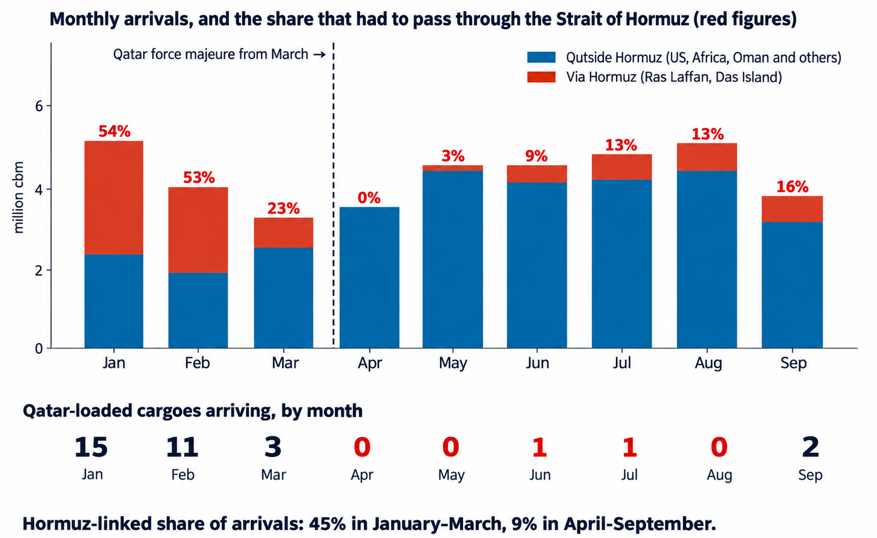
Qatar was the backbone of the first quarter. In January, 15 Qatari cargoes arrived. In February, 11. In March, three, the last on 5 March. These ships had loaded before the war began.
After that, the flow almost stops. April and May show no Qatari cargo. August shows none either. Only four Qatari cargoes arrive in the seven months after 5 March. By that date, 29 of the 33 Qatari cargoes in the list had already come in.
The wider market tells the same story. Qatar exported only 18 LNG cargoes in the first six months of the war, against 509 a year earlier. Attacks on Ras Laffan also damaged two production units and cut capacity by about 17%.
From more than half to a trickle
Qatar is not the only Gulf supplier. The UAE’s Das Island plant also sits inside the Gulf. Counting both, cargoes that had to cross Hormuz made up 54% of arrivals in January and 53% in February. In March the share fell to 23%. In April it was zero.
It has crept back to 16% by September, as a few Emirati and Qatari ships found a way out. Across the period, Hormuz-linked cargoes were 45% of arrivals in the first quarter and just 9% from April to September.
The UAE shows a slightly different pattern. Das Island cargoes stopped in April, then returned: one in May, two in June, three in July, four in August and three in September. Emirati ships seem to have found a way through sooner than Qatari ones. Khor Fakkan, on the UAE’s east coast and outside the Strait, added three cargoes.
The IEA has said the combined oil and gas impact of the war amounts to ‘the greatest threat to global energy security in history’. About 20% of global LNG supply moved through the Strait in 2025. The agency says over 2 billion cubic metres of gas has gone missing from the market every week.
Who filled the gap
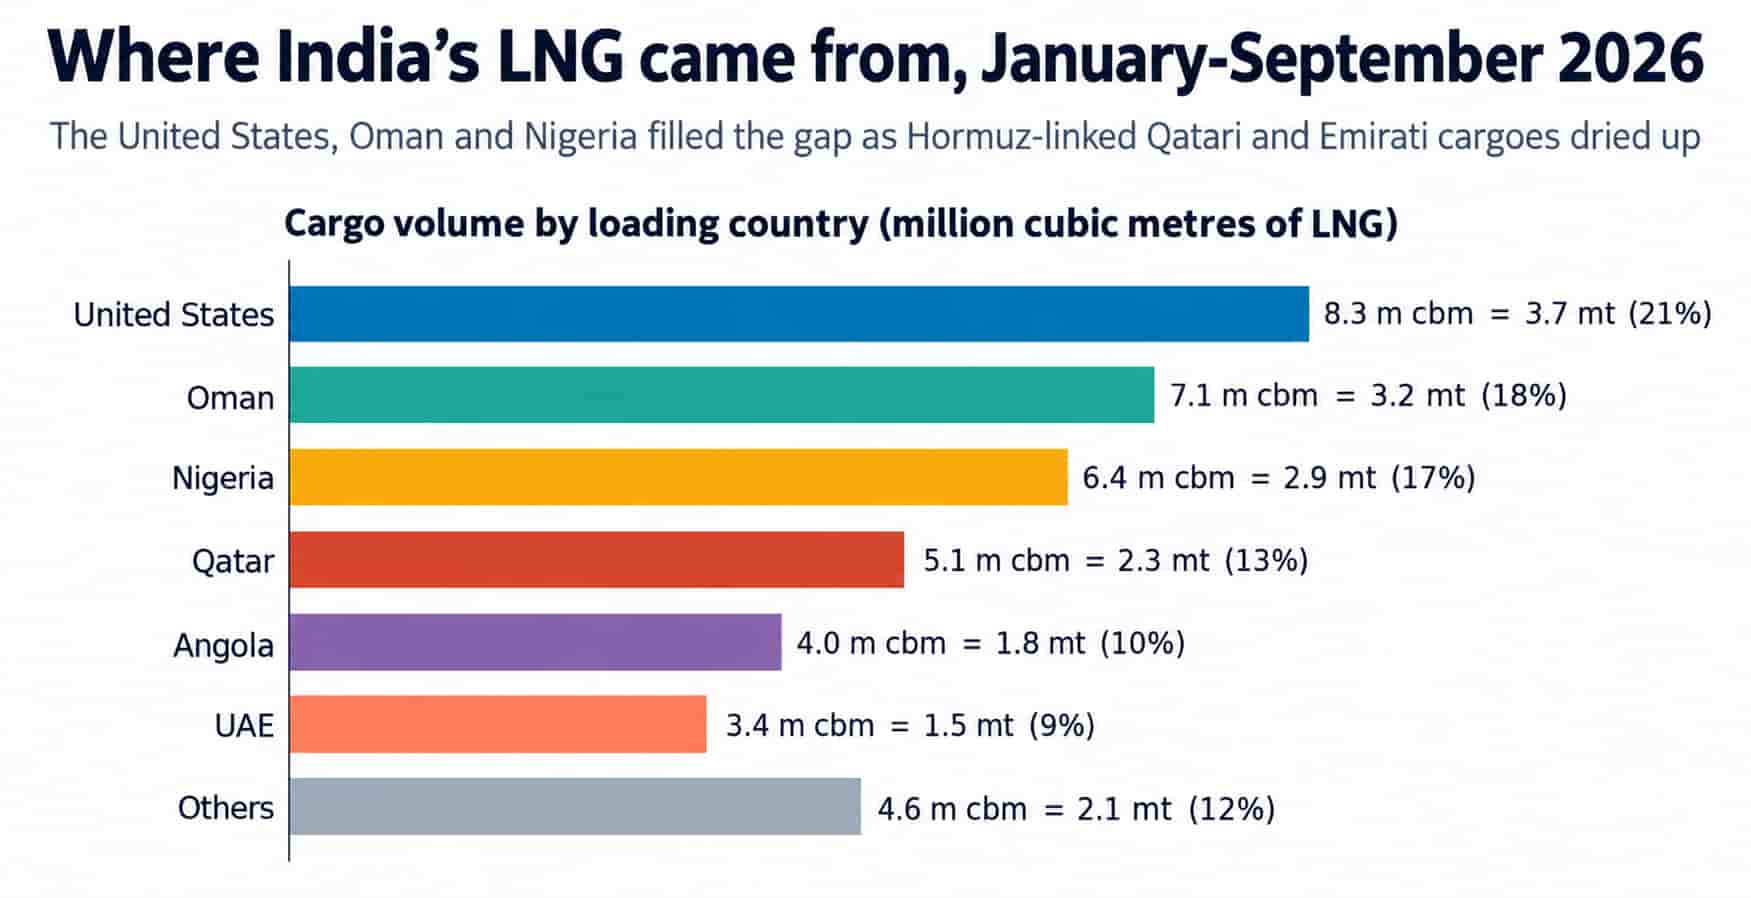
Three suppliers did most of the work. The US sent 8.3 million cubic metres, or 21% of the total, making it the largest source for the nine months. Oman followed with 7.1 million (18%) and Nigeria with 6.4 million (17%). Angola added 4.0 million (10%).
In the first quarter, the three leaders supplied about 34% of arrivals. From April to September, they supplied about 67%. US cargoes peaked at 1.87 million cubic metres in May, against 0.31 million in January.
Oman is the quiet story. Its Qalhat plant sits outside the Strait, on the Gulf of Oman side, so its cargoes were free to leave. Oman’s monthly volume almost tripled, from 0.43 million cubic metres in January to 1.16 million in September. Nigeria did the same, rising from 0.41 million in January to 1.12 million in August.
West Africa matters as much as Oman. Nigeria and Angola, along with smaller sources such as Equatorial Guinea and Mozambique, supplied about 30% of all arrivals. Their share rose from 25% in the first quarter to 33% from April to September.
Independent estimates match this. India imported 7.08 million tonnes of LNG from May to July, up 15% from a year earlier. US supply rose 253% to 2.19 million tonnes, while Qatar’s fell 91%.
The buyers’ choices stand out. GAIL and IOCL took 48 of the 60 US cargoes in the list. Petronet LNG, whose long-term contract is with Qatar, received 24 of its 47 cargoes from there, and 23 of those arrived by 5 March. Its other cargoes came from different suppliers.
Volumes held, but supply is stretched
Total volumes did not collapse. Monthly arrivals averaged about 4.4 million cubic metres from April to September, against 4.2 million in the first quarter.
The path was not smooth. March was the weakest month, at 3.3 million. September slipped to 3.8 million, from 5.1 million in August. Other trackers also show a fall. India’s September LNG imports dropped 14% to 2.17 million tonnes, with Oman the largest supplier at 27%.
A port-call list shows who arrived and when. It does not show prices or contract terms, so the cost of this shift is still unclear. One less visible change is cargo size. About 7% of first-quarter arrivals were part-cargoes of under 100,000 cubic metres. From April to September, the share was 21%. This points to buyers splitting cargoes and picking up whatever prompt volumes they could find.
The IEA says the shock reached Indian consumers. In 2025, LNG from Hormuz made up almost 30% of India’s primary gas supply. The government invoked the Essential Commodities Act and issued the Natural Gas (Supply Regulation) Order 2026.
Supplies to power plants and fertiliser producers were reduced, while households and transport were protected.
New suppliers, new limits
Diversification is not the same as safety. Oman has one export plant, at Qalhat, so its room to grow is limited. US cargoes travel much farther than Qatari ones. Europe and North-East Asia are also chasing the same non-Gulf cargoes.
Prices are another test. Spot gas prices in Asia and Europe reacted swiftly to the shock, and buyers who depend on the spot market carry that risk directly.
What winter will test
The next test is close. QatarEnergy has extended force majeure on LNG to Asia and Europe through November. Pakistan and Bangladesh were told cancellations continue, and at least one Indian buyer was told the measure remains.
Some Qatari cargoes are moving again. The list shows two in September, one of them a 213,000 cubic metre carrier. That is welcome, but small. The IEA estimates that lost supply and slower capacity growth could remove about 140 billion cubic metres of LNG between 2026 and 2030.
For India, three things follow. Term contracts with US and African suppliers matter more now, and GAIL and IOCL already show how this works. Dahej took about two-thirds of arrivals in the list, which is a concentration risk. And if a cold winter pulls cargoes towards Europe and North-East Asia, gas rationing could be tested again.
India changed course fast. It did not stop buying. It bought elsewhere. The harder question is how long that can last at a price its fertiliser, power and city gas users can bear.
Follow us on : X | LinkedIn | Facebook | Bluesky